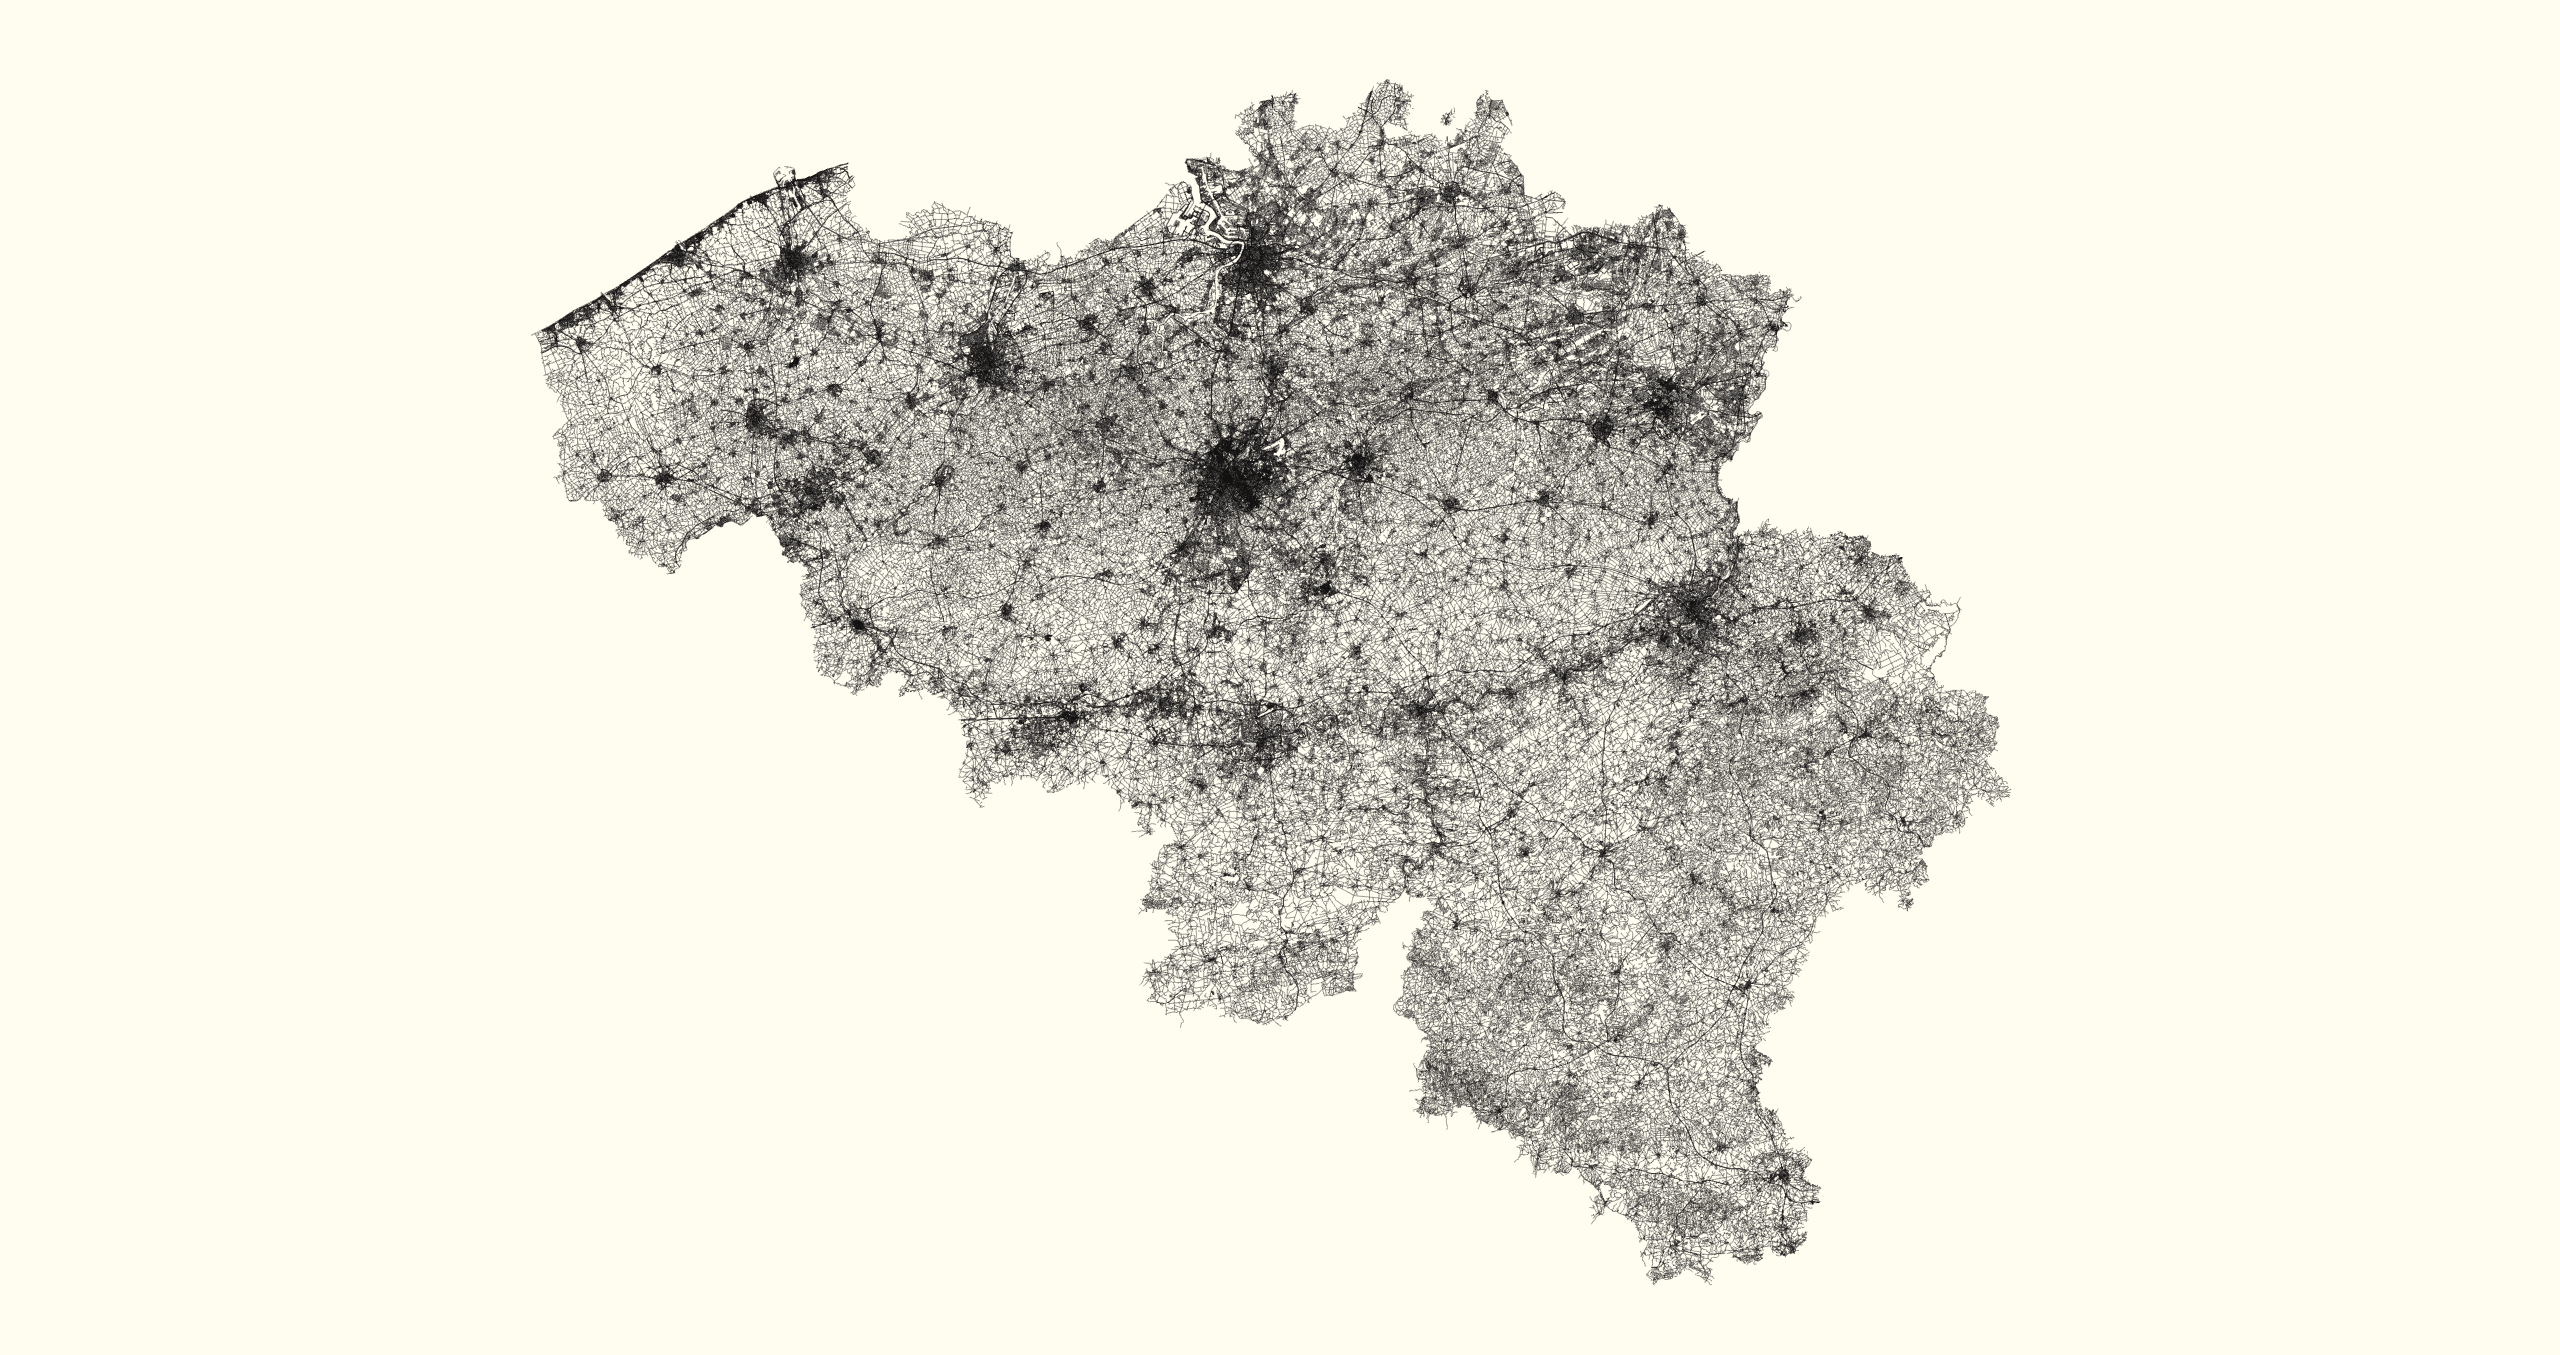
When exploring Overture data earlier this month, I stumbled upon “All Streets” by Ben Fry. I loved the visualisation and wondered how I could reproduce it for other countries. Looking at Ben Fry’s writing archive, he briefly discussed his work in a blog post from 2008:
Nothing particularly genius about this piece—it’s mostly just a matter of collecting the data and creating the image. But it’s one of those cases where even in a (relatively) raw format, the data itself is quite striking.
“Collecting the data and creating the image”: as easy as drawing an owl. Luckily, the rest of the blog post reveals a bit more of the process — but sadly doesn’t really help me in reproducing it for other countries.
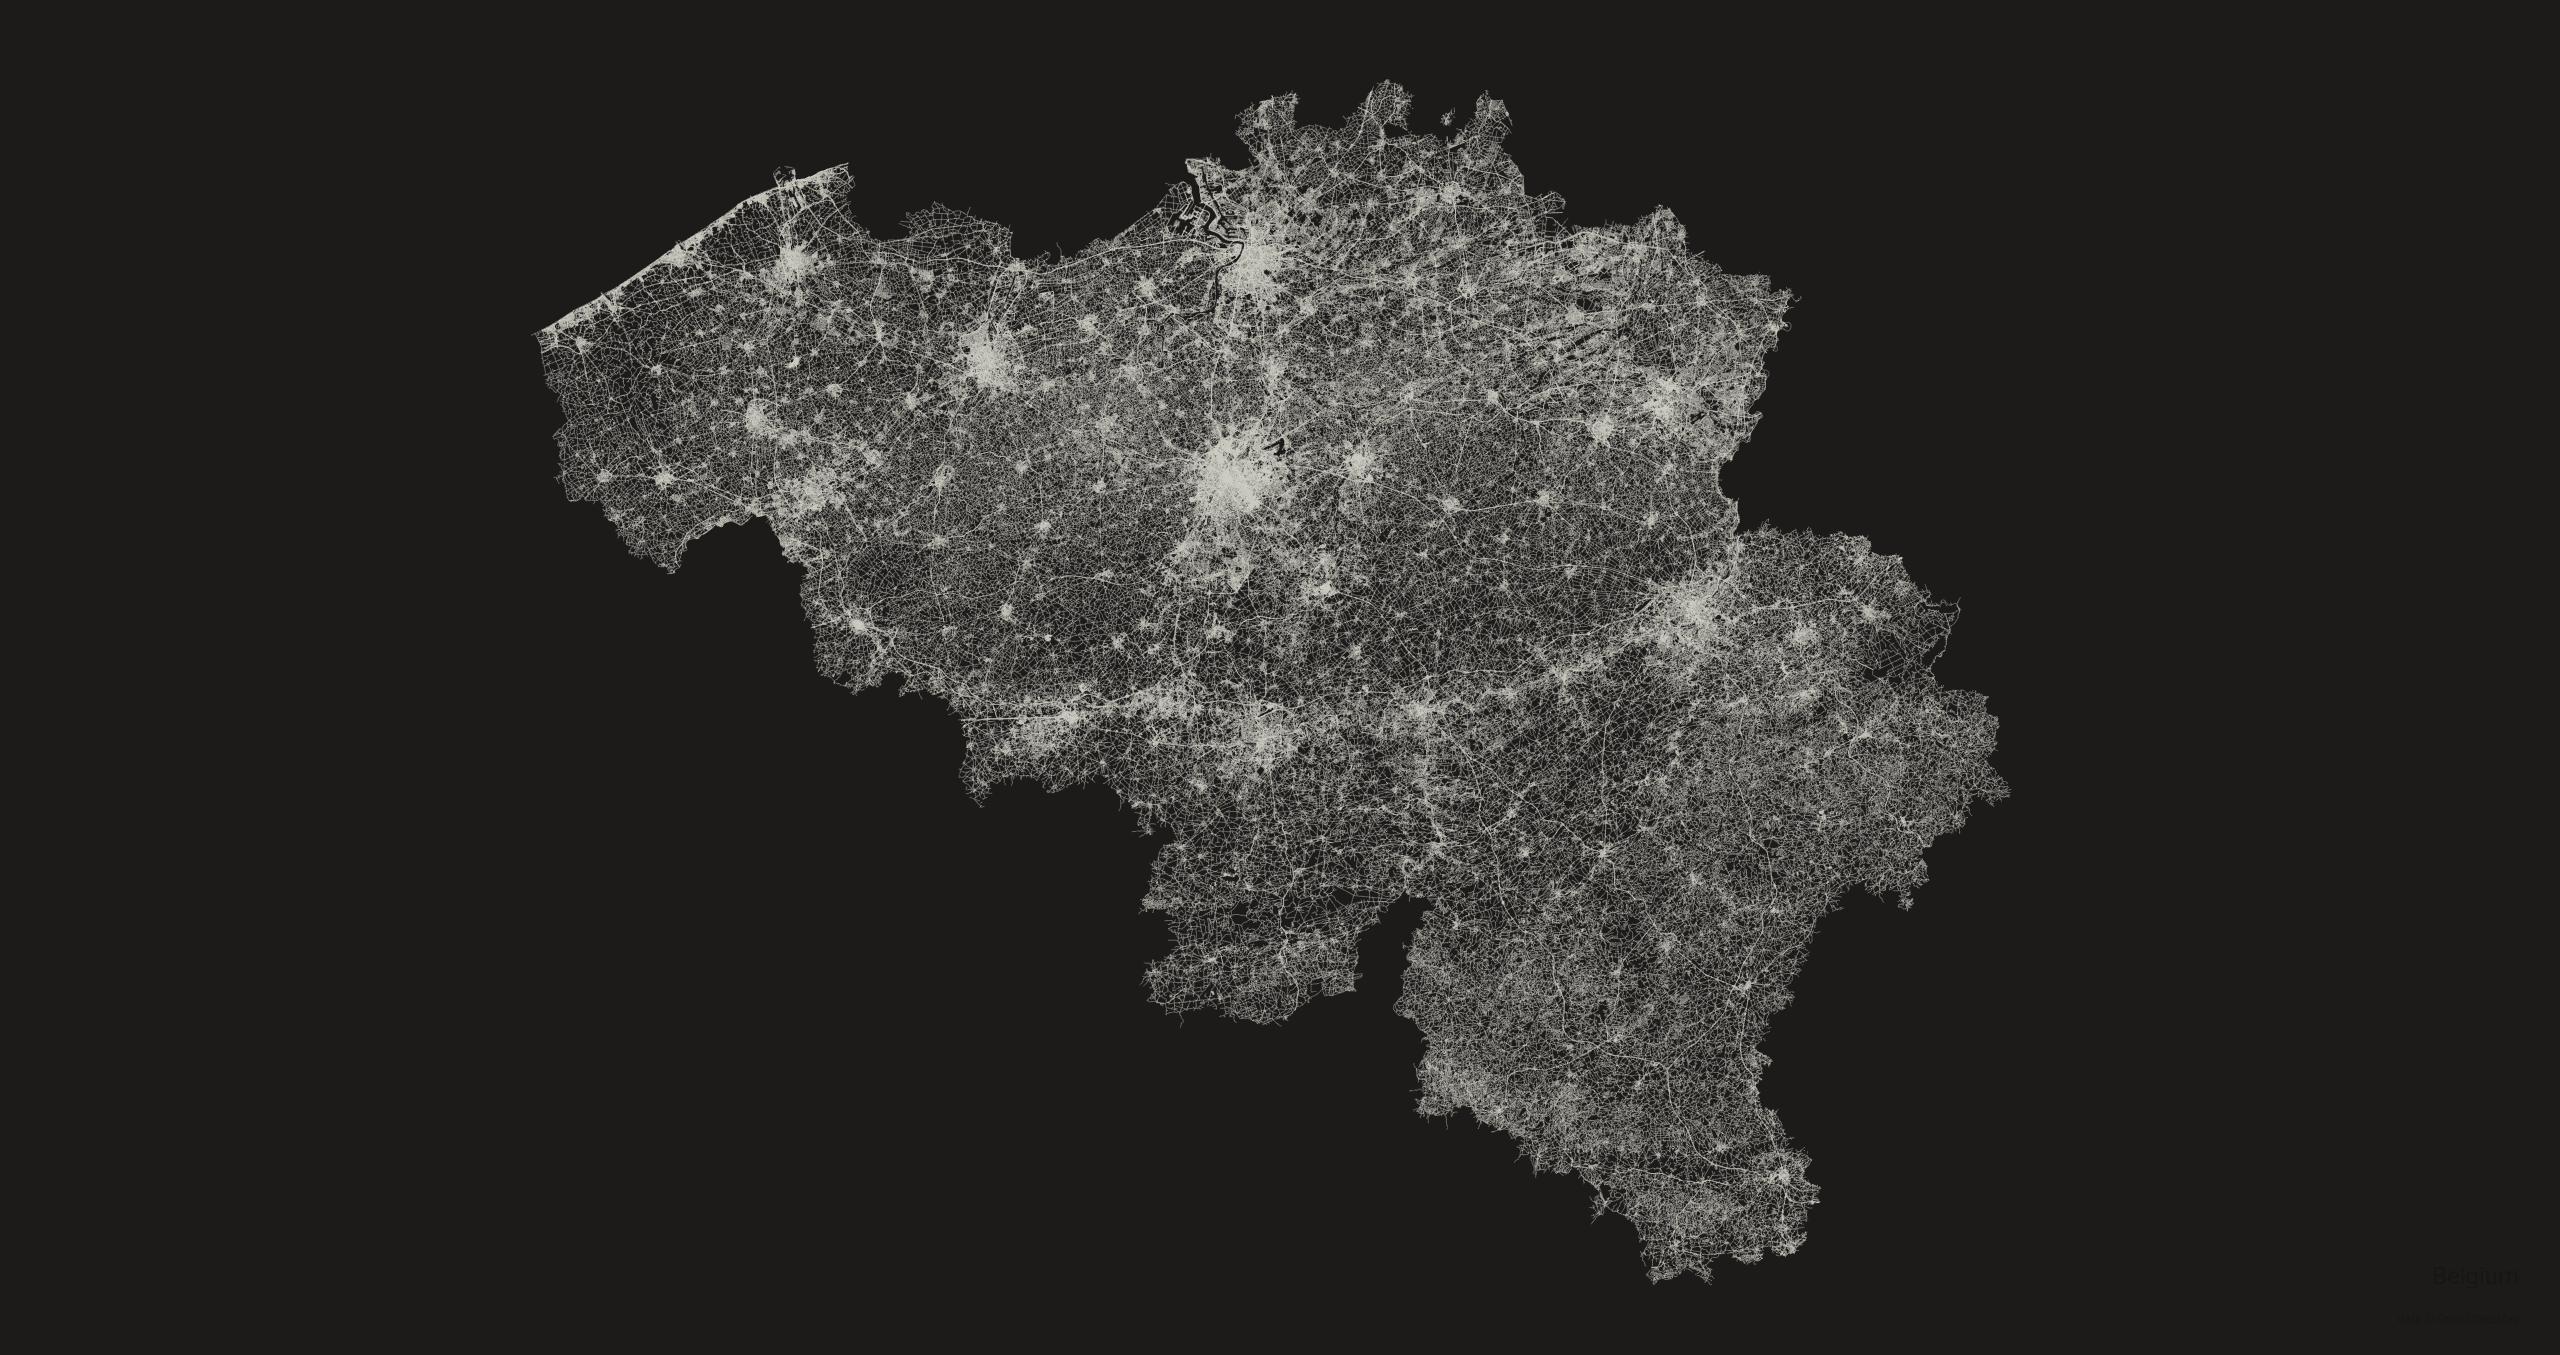
After a bit of Googling, I found great work by Andrei Kashcha: city-roads, which allows you to render roads in any area using data from OpenStreetMap, which I used for the image at the top of this note. I plan to dive into the open-sourced code of city-roads, and I might try to make something similar from scratch using Overture (just to learn how it works, as inspired by a comment on lobste.rs):
You should make a toy version of every major tool you use, if you can find the time and energy to do so. It’s a great way to understand the constraints that go into the tools you use and the limits of their capabilities.
I want to do something similar as city-roads, but expand it by combining it with Overture Places data. Possibilities for visualisation include heatmaps for distance from road segments to specific types of places (like the nearest train station or bus stop, for example), or create a Chronotrains-style alternative on a Belgian map, using open data from NMBS, De Lijn, and TEC.